For quite a while now, we've been working on building
beautiful, interactive widgets
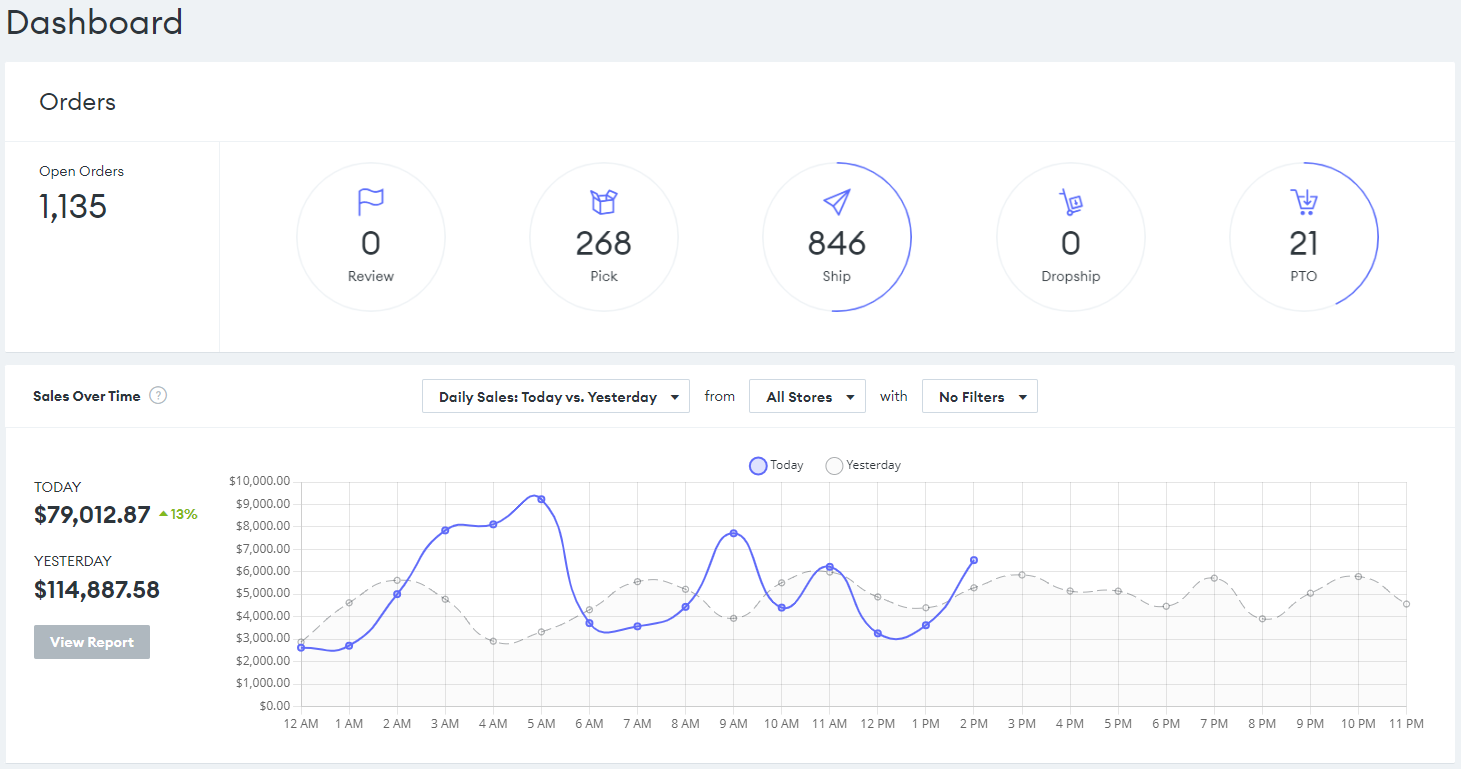
that provide valuable insight into your business. The first one of these is now live:Sales Over Time
The widget
compares total sales for two periods over time
, with options to view daily
, weekly
, or monthly
data for any selected dates.Graphed sales data is presented in
hourly or daily intervals
, providing a clear representation of your business's performance
.
This widget is only visible to users with the
SalesReports
role.