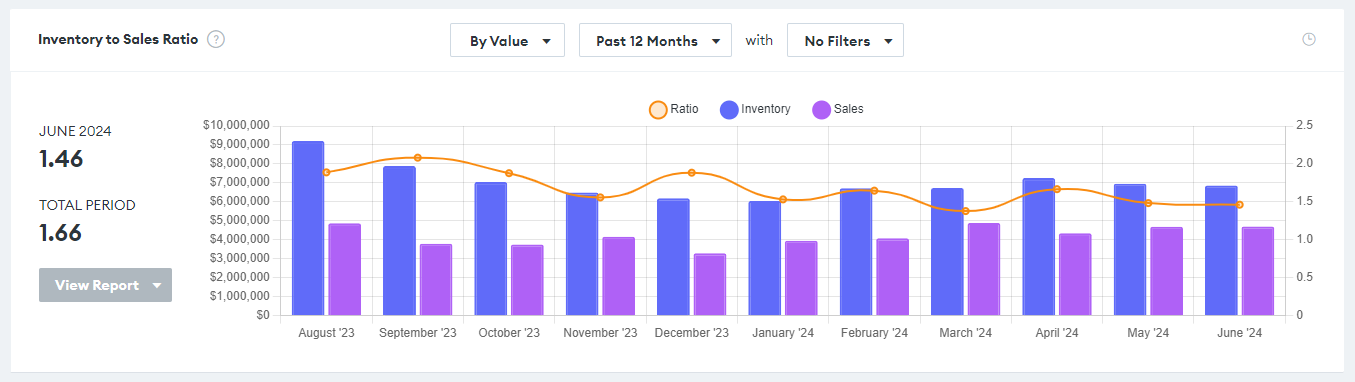
We have a new
beautiful, interactive analytics widget
that plots your inventory compared to your sales for each period, over time.The inventory to sales
ratio
shows how much inventory you hold compared to your sales
.Use this interactive chart to quickly gauge the health of your business.
A higher ratio can indicate excess inventory
, tying up capital, while a lower ratio may suggest stockouts
.The optimal ratio differs from business to business. It depends on many different factors, such as business models and strategies, seasonal products, or products with long lead times.
🔓 Visible to users who have both the
SalesReports
and InventoryReports
roles.