We now have 3 new
beautiful, interactive analytics widgets
:🔘
Top Sellers
🔘
Inventory Over Time
🔘
Inventory Aging
🔘
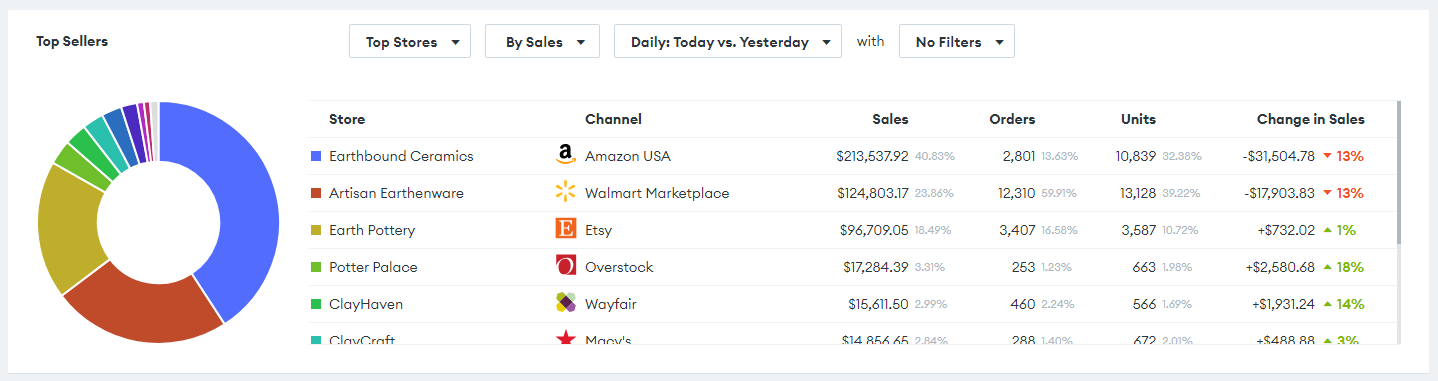
Top Sellers
shows your top sellers for the given period, and compares their sales to the previous period.Can be customized to show:
- Top Stores
- Top Listings
- Top Products
- Top Brands
- Top Warehouses
Choose to view the top 10 by:
- Sales Revenue
- Orders Received
- Units Sold
🔓 Visible to users with the
SalesReports
role.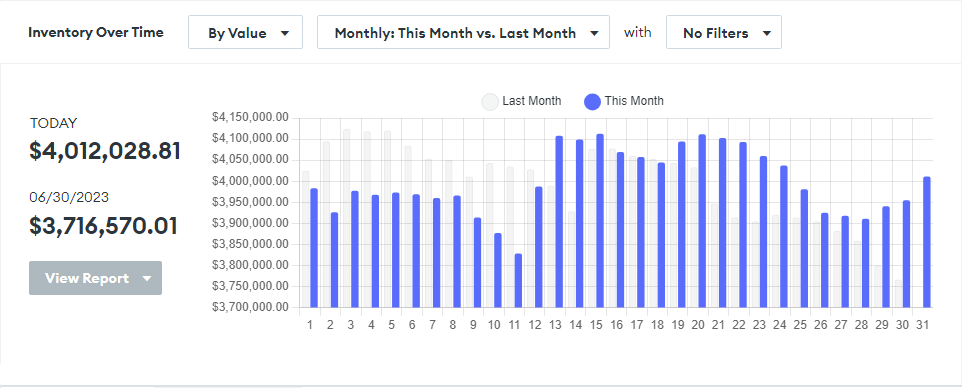
🔘
Inventory Over Time
graphs your inventory levels over a period of time, and compares it to the previous period.This gives you
valuable insight into how your inventory levels are performing
over time.Choose to view inventory levels:
- By Value
- By Units
🔓 Visible to users with the
InventoryReports
role.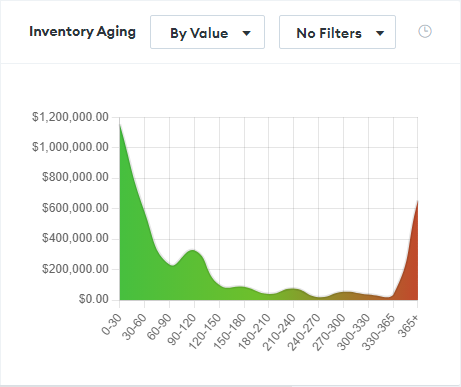
🔘
Inventory Aging
graphs your inventory's age in a colored histogram, giving you a quick bird's eye view of the overall health
of your inventory.Choose to view inventory aging:
- By Value
- By Units
🔓 Visible to users with the
InventoryReports
role.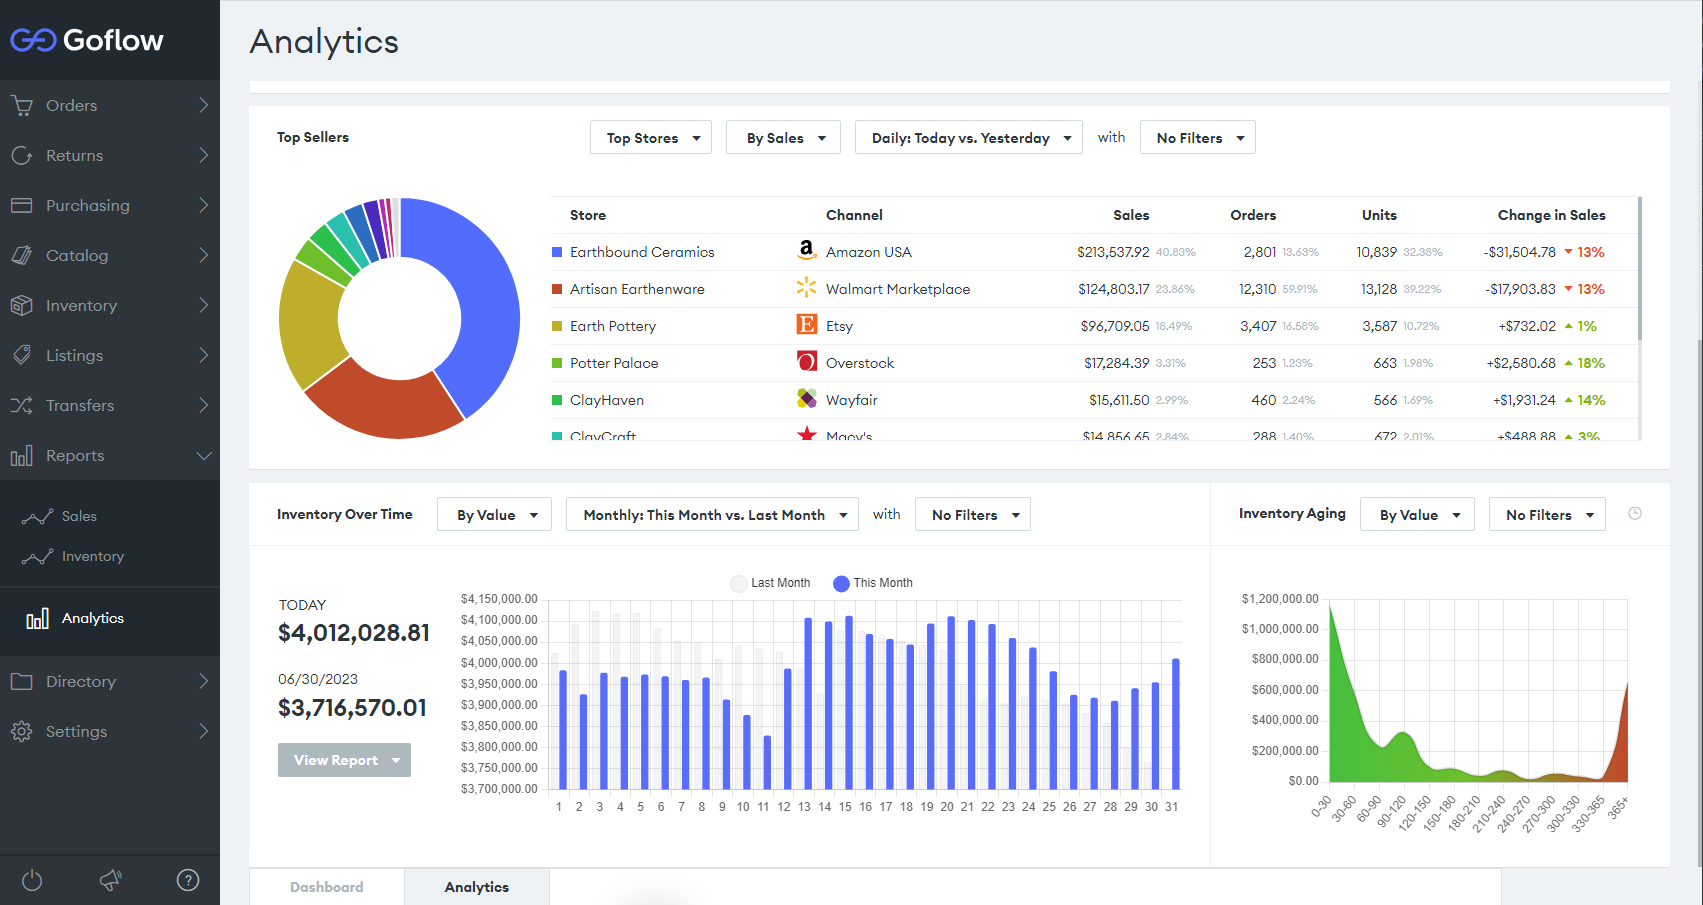
These 3 widgets join the existing Sales Over Time widget on the
new Analytics page
, available to users who have either the SalesReports
or InventoryReports
role.🔓 On this page,
users will only see the widgets to which they have the correct permissions
, based on the aforementioned roles.